> ## Documentation Index
> Fetch the complete documentation index at: https://www.mintlify.com/docs/llms.txt
> Use this file to discover all available pages before exploring further.
# Analyze documentation traffic
> Review traffic analytics to track visitors, page views, referrals, popular pages, and traffic from both human readers and AI agents.
Analytics require a [Pro or Enterprise plan](https://mintlify.com/pricing?ref=analytics).
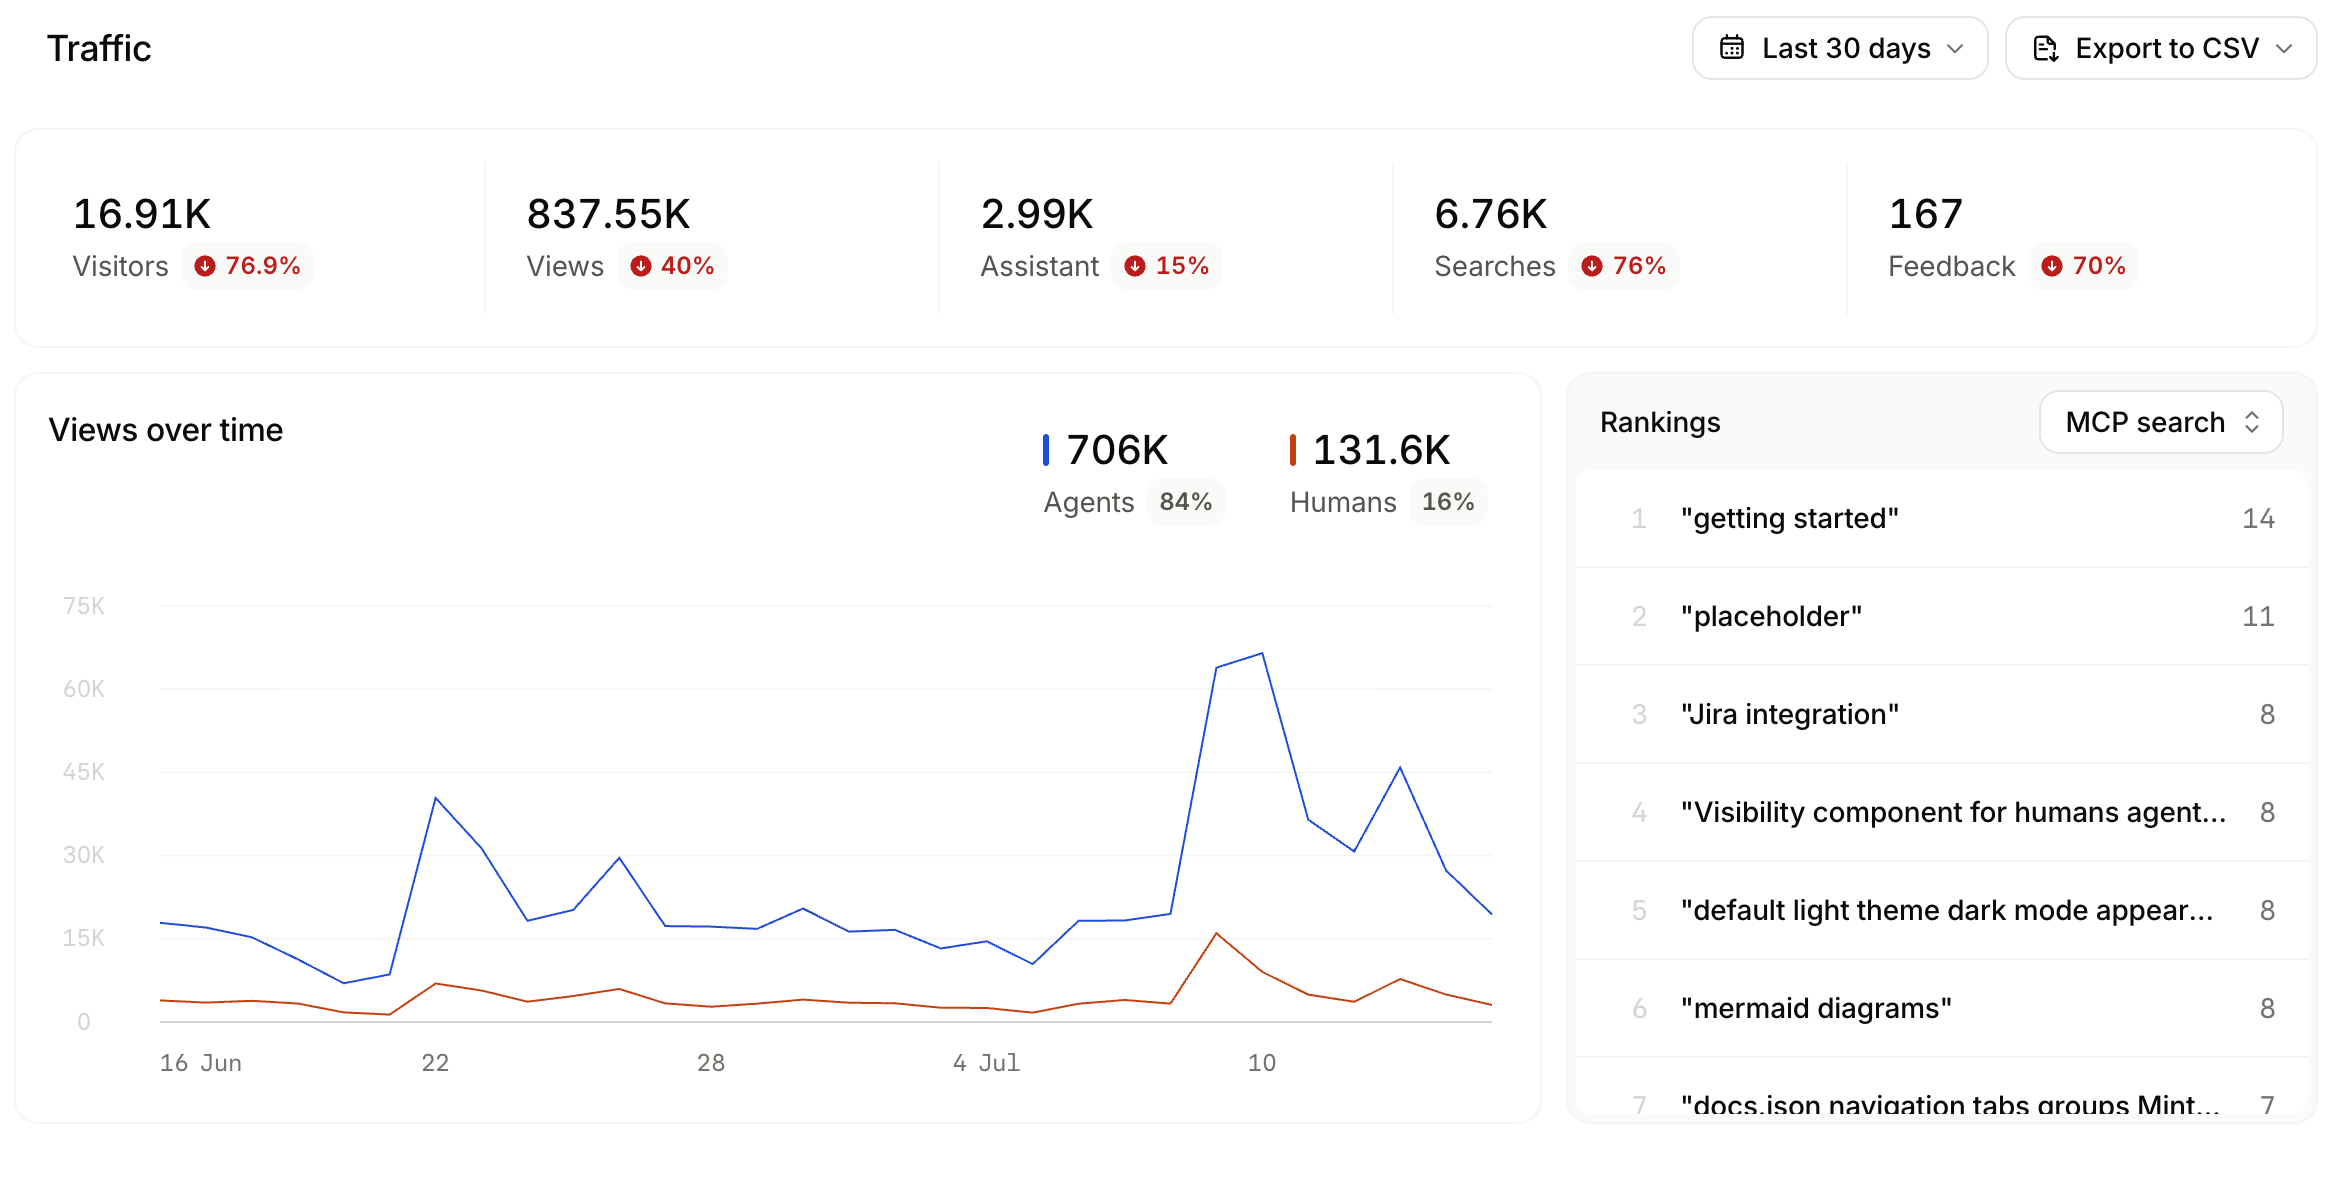
The **Traffic** view of the [analytics](https://app.mintlify.com/analytics) page displays total visitors, page views, assistant conversations, searches, and user feedback messages.
Review traffic analytics to:
* **Monitor traffic trends**: Observe changes in human and agent traffic after updates or new content to understand the impact of your changes.
* **Identify popular pages**: Use highly ranked pages to understand what content is most important to your users. Keep those pages up to date and comprehensive.
* **Track referral sources**: Understand where your users come from so you can optimize content for the right audience.
 ## Interpret agent views
Mintlify identifies agent visitors by IP address and user agent. The agent visitor count approximates distinct sources of AI traffic rather than individual agent sessions or conversations. Multiple requests from the same IP address count as one visitor.
Agent traffic measurement expanded in June 2026. Before then, the analytics dashboard only captured a subset of agent traffic. Starting June 8, 2026, Mintlify recognizes a broader set of agent user agents, counts agent HTML page views alongside Markdown requests, and serves Markdown to more agents. As a result, agent views increased across most sites around that date. This reflects improved measurement and agent access, not a sudden change in traffic. When comparing agent views over time, account for this shift.
The size of the increase varies by site, since it depends on how much agent traffic each site receives. Sites that AI tools reference frequently show a larger increase than sites with less agent traffic.
Use agent views to understand:
* **AI agent distribution**: See which AI platforms access your docs to learn which tools your users prefer.
* **Integration opportunities**: Identify which AI platforms to prioritize for optimization and testing.
* **AI traffic patterns**: Monitor which agents are most active and how their usage changes over time.
## Related topics
- [Analyze documentation searches](/docs/analytics/search.md)
- [Analytics overview](/docs/analytics/index.md)
- [Collect page feedback from users and AI agents](/docs/optimize/feedback.md)
## Interpret agent views
Mintlify identifies agent visitors by IP address and user agent. The agent visitor count approximates distinct sources of AI traffic rather than individual agent sessions or conversations. Multiple requests from the same IP address count as one visitor.
Agent traffic measurement expanded in June 2026. Before then, the analytics dashboard only captured a subset of agent traffic. Starting June 8, 2026, Mintlify recognizes a broader set of agent user agents, counts agent HTML page views alongside Markdown requests, and serves Markdown to more agents. As a result, agent views increased across most sites around that date. This reflects improved measurement and agent access, not a sudden change in traffic. When comparing agent views over time, account for this shift.
The size of the increase varies by site, since it depends on how much agent traffic each site receives. Sites that AI tools reference frequently show a larger increase than sites with less agent traffic.
Use agent views to understand:
* **AI agent distribution**: See which AI platforms access your docs to learn which tools your users prefer.
* **Integration opportunities**: Identify which AI platforms to prioritize for optimization and testing.
* **AI traffic patterns**: Monitor which agents are most active and how their usage changes over time.
## Related topics
- [Analyze documentation searches](/docs/analytics/search.md)
- [Analytics overview](/docs/analytics/index.md)
- [Collect page feedback from users and AI agents](/docs/optimize/feedback.md)